
(Million Yen)
| Fiscal Year | March 2017 |
March 2018 |
March 2019 |
March 2020 |
March 2021 (planned) |
||
|---|---|---|---|---|---|---|---|
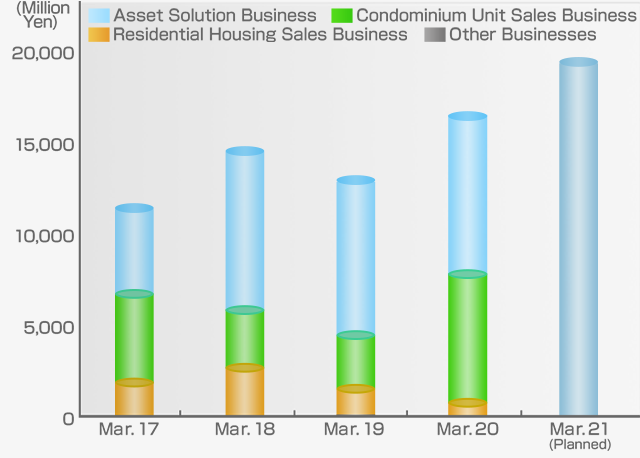
| Net Sales | 11,301 | 14,994 | 13,122 | 16,907 | 19,830 | ||
| Asset Solution Business | 5,487 | 9,882 | 8,335 | 8,944 | - | ||
| Condominium Unit Sales Business | 4,027 | 2,411 | 3,119 | 7,157 | - | ||
| Residential Housing Sales Business | 1,769 | 2,633 | 1,525 | 741 | - | ||
| Other Businesses | 17 | 67 | 141 | 64 | - | ||
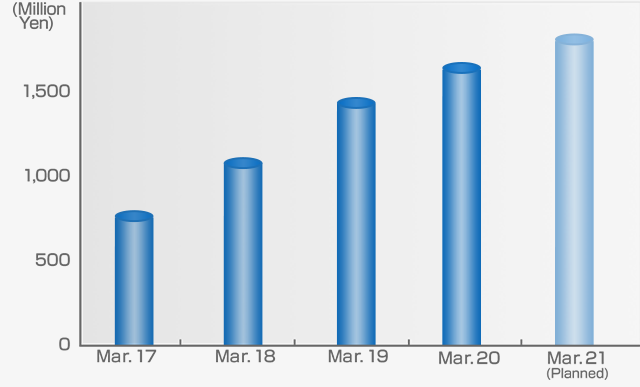
| Ordinary Income | 730 | 1,043 | 1,388 | 1,570 | 1,730 | ||
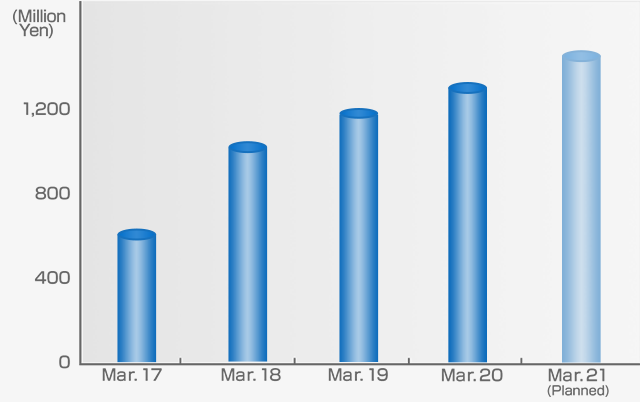
| Net Income | 669 | 1,076 | 1,167 | 1,328 | 1,450 | ||
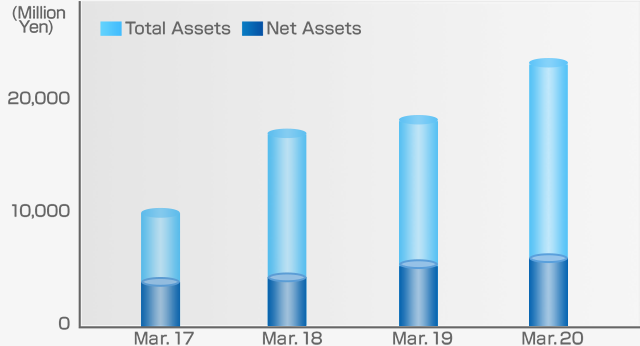
| Net Assets | 3,635 | 4,385 | 5,322 | 6,298 | - | ||
| Total Assets | 9,964 | 16,897 | 18,882 | 23,254 | - | ||
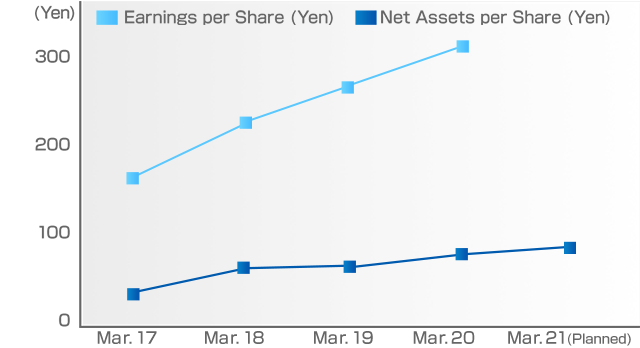
| Net Assets per Share (Yen) | 167.62※ | 220.31※ | 267.38 | 316.47 | - | ||
| Earnings per Share (Yen) | 33.61※ | 54.08※ | 58.63 | 66.73 | 72.85 | ||
(Note) As of October 1, 2013, the Company has consolidated shares at a ratio of one share per 5 shares of common stock.
Net assets per share and net income per share are calculated assuming that such consolidation was made at the beginning of the fiscal year ending March 31, 2016.
-
Net Sales
-
Ordinary Income
-
Net Income
-
Net Assets, Total Assets
-
Net Assets per Share (Yen), Net Income per Share (Yen)
(Note) It's consolidated numerical value from fiscal year finished on March 31 and 2012 before. An individual numerical value is indicated from the fiscal year finished on March 31 and 2013
